
 William Cope
 Adam P Rusch
 Jason Berg
 Duane Searsmith
.png "Rita van Haren") Rita van Haren
Rita van Haren Eric Patnoudes
 Maura Rodgers Brand
 Jason Williams
 Heather A Ochman
e-Learning Ecologies MOOC’s Updates
Essential update #3: Visual learning
Multimodal learning takes place learners are using text, diagrams, tables, datasets, audio recordings, videos, and other media to understand concepts better. This is made easy today by using digital technologies. Learners can now easily move forwards and backwards between various modes (called synaesthesia).
Learners nowadays grow up in a very visually stimulating environment – television, cell phones, tablets, computer games, X-Box games, etc. One can understand that they get easily bored in a traditional classroom where very little visual stimuli is present and where the range of visual stimuli is limited.
For a teacher to be able to engage her learners, it is imperative that she must make use of multimodal learning – not only that which she uses, but also what she expects her learners to be able to use and link.
Learning styles
Three learning styles exist, namely auditory, visual and tactile. The auditory earner learns by hearing and listening. The tactile learner learns by touching and doing – he needs to move, build or draw while he learns. The visual learner learns by reading or looking at pictures. He remembers things by sight (Education Planner, 2019) .
What will a visual learner typically add to online projects?
He will typically make use of lots of images, pictures, colour, maps and other visual media.
Mind maps that use colour and pictures in place of text will be popular to “see” the big picture as well as drill down into more depth of a topic.
Systems diagrams that enable one to visualize the links between parts of a system can also be very useful (Learning-styles-online, 2019).
Research has shown the power of visual aids in eLearning. It has been found that learners respond to visual information faster than to text only materials. Visuals help learners to improve their comprehension and to remember what they have learned. About 65% of learners are visual learners.
Advantages of visual aids:
- Help Store Information Longer
- Images are most effective way to get information to be stored as a long-term memory.
- Make Communication Quicker And Simpler
- According to the Visual Teaching Alliance:
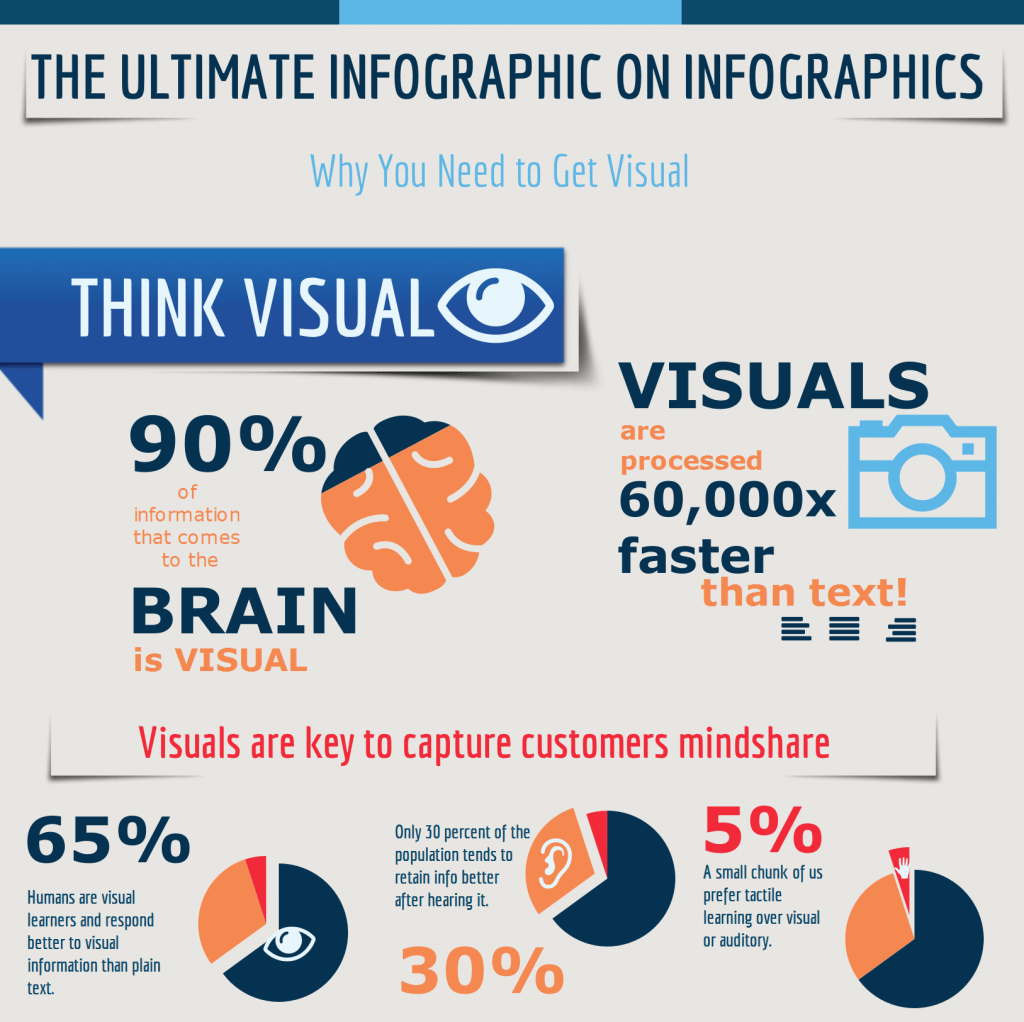
- 90% of information transmitted to the brain, is visual.
- Visuals are processed 60,000x faster than text.
- Humans are capable of getting the sense of a visual scene in less than 1/10th of a second.
- 40% of nerve fibres are linked to the retina.
- Our brain can see images that last for only 13 milliseconds.
- Human eye can register 36,000 visual messages every hour.
- Hence, the eLearning programs which incorporate suitable visuals gain a higher preference over the text-only ones.
- Aid Better Comprehension - Visuals help learners comprehend new work easier by affecting their cognitive capabilities.
- Act As Stimulators For Emotions - The same part of the human brain processes emotions and visual information. Visual stimuli and emotional responses together generate memories, and therefore also aids in remembering new concepts.
(E-Learning industry, 2019).
Here is an infographic explaining the power of visuals in learning:

(Source: https://www.cmdsonline.com/wp-content/uploads/infographicsnapshot1-1.png)
Why is using visuals such as infographics so important in a world where knowledge overload is on the rise? Watch this video!
https://youtube.com/watch?time_continue=19&v=pLDxBbQcwNY
An interesting tool...
Because of the increased interest in multimodal data collection in the learning sciences, there is a demand for new and powerful methodological and analytical techniques. A Graphical User Interface(GUI) known as SLAM-KIT has been designed to facilitate data visualisation and processing with respect to the regulation of learning. It allows users to travel through the learners' data and its statistical characteristics. The nice thing about this is that “it simplifies complex information and data while making them available through visualisation and analysis to the researchers” (Noroozi, 2018). Currently, it is used by researchers. Work is being done to target teachers and learners as well. It is envisaged that the SLAM-KIT tool could provide learners with mental and metacognitive learning processes in terms of visualisation. This can enable learners to become more independent and thus better regulate their learning activities (Wang et al., 2011).
The sky is really the limit if we start to harness the possibilities of multimodal learning that is being made possible by the digital era of visuals and other resources today!
References
Education Planner, 2019. Derived from: http://www.educationplanner.org/students/self-assessments/learning-styles-styles.shtml)
E-Learning industry, 2019. Derived from: https://elearningindustry.com/visual-learning-6-reasons-visuals-powerful-aspect-elearning
Learning-styles-online, 2019. Derived from: https://www.learning-styles-online.com/style/visual-spatial/
Liu, Y. et al. (2018) ‘Learning visual and textual representations for multimodal matching and classification’, Pattern Recognition, 84, pp. 51–67. doi: 10.1016/j.patcog.2018.07.001.
Noroozi, O. et al. (2018) ‘Multimodal data to design visual learning analytics for understanding regulation of learning’, Computers in Human Behavior. doi: 10.1016/j.chb.2018.12.019.
Wang et al. (2011) M. Wang, J. Peng, B. Cheng, H. Zhou, J. Liu. ‘Knowledge visualization for self-regulated learning’, Educational Technology & Society, 14 (3) (2011), pp. 28-42
well illustrated. I, for sure will save this for future reference.